
")
What are the environmental issues around me? How do economic activities such as agriculture, fishing, tourism and industry affect the environment and local communities? Drawing a sensitive map of our environment can be very useful in understanding the social, economic, cultural and environmental issues of a given place.
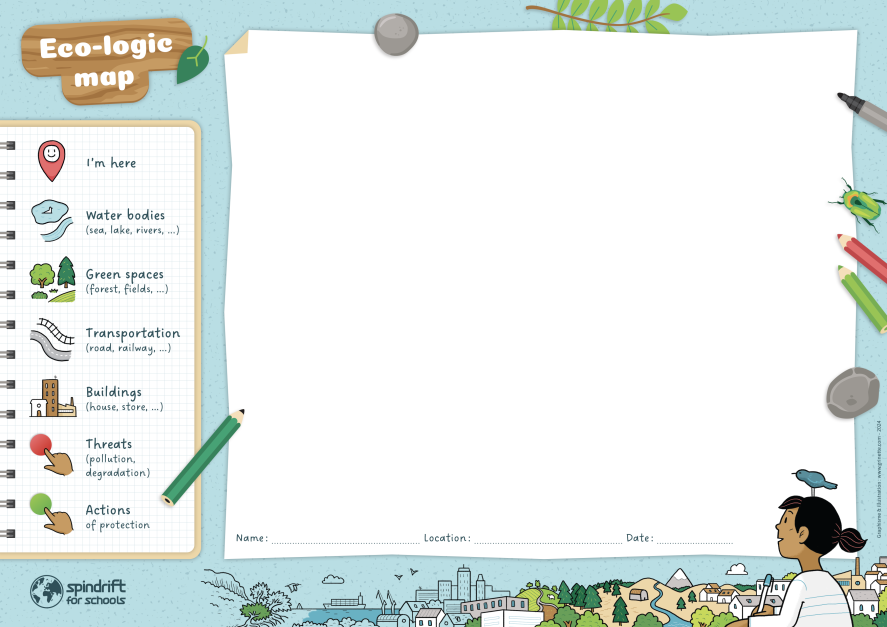
What is a sensitive map?
A sensitive map is a visual representation that takes into account the sensibility of the person drawing it. It is not a factual or scientifically accurate representation. This work can be carried out by our educational teams in workshops or outdoors, but the support illustrated by Grinette can be downloaded free of charge so that you can use it yourself in the classroom with your groups.
This "ECO-LOGIC MAP" offers you the opportunity to take a geography-based approach that leaves room for sensitive experiences and emotions, enabling you to take a sensitive, personal approach to the land. By creating a sensitive map, you'll be able to better understand the environment as a whole and help raise awareness of the issues surrounding your unique and probably fragile region.
How to run this workshop in class (duration approx. 1 hour, from age 7)
To create a sensitive map of a place, it is important to take into account its environmental, cultural, economic and social aspects. To make it comprehensible to everyone, it is also important to use and respect a legend (colour code). Here are a few tips and steps to help you create a successful sensitive map:
- Beforehand, define the subject of study that interests us and the perimeter of the area concerned (region, town, village, forest, beach, etc.).
- Research the location. Before starting to create the map, the pupils find out about the place and the different aspects that make it up.
- Read articles about the ecosystems, animal and plant species, history and culture of the region, as well as economic activities and social issues.
- Using your research, identify the key areas that deserve to be represented on your sensitive map. For example, for an archipelago such as the Galapagos, you might choose to represent the different islands in the archipelago, national parks, tourist sites, fishing zones or conservation areas. For a port city, you can choose to represent the different ports and quays, tourist sites, fishing areas or industrial zones. For the countryside, use symbols to represent the different activities that take place, such as farming, animal husbandry, hunting, fishing, gathering and so on.
- Use symbols to represent environmental aspects such as animal and plant species, conservation areas, protected marine areas, etc.
- Use colours to represent the cultural aspects of the place, such as historic sites, museums, cultural events, etc.
- Use shapes to represent economic and social aspects such as economic activities (fishing, agriculture, tourism), infrastructure (ports, airports, roads), inhabited areas, etc.
- To make your map understandable to everyone, don't forget to add legends explaining the symbols, colours and shapes you've used.
To facilitate your workshop, download the instructions for pupils.
This document is for educational and non-profit use only. All rights reserved to the Spindrift for Schools Endowment Fund.